By Maxwell O. Ramsland, Jr., MAI, CRE and Shannon M. Luepke
Market value is the standard by which appraisers, assessors, and other valuation professionals conduct their practices. Market value versus price is an issue that has been debated for decades by valuation professionals. Price, whether it’s a single sale or an aggregate of community based sales, is clearly an indication of market value when adjustments are made for dissimilar characteristics. Cost, while a corollary of both price and value, is an attribute of far less significance when viewed from a strict market perspective. Yet, cost remains a valuable yardstick for appraisers.
The department store conundrum involves both price and value, and to a lesser degree cost. The department store conundrum was first articulated by Professors William Kinnard and Jeffrey Fisher when they hypothesized, in effect, “…if it cost $70.00 per square foot to build an anchor department store, then why is it when they sell, they sell for about half of their replacement cost new?”
While Fisher and Kinnard’s conjecture is not as challenging as it once was, the solution is complex. They contend that the answer lies with the business enterprise feature of the property and emanates partially from the developer’s subsidy of the department store. The authors herein contend that Fisher and Kinnard’s conjecture is correct as far as it goes, but there is new empirical evidence from the marketplace that more fully explains the department store conundrum. That evidence consists of several market sales of anchor department stores of variable ages experiencing steep discounts from their actual cost and/or replacement cost new. The evidence strongly suggests that Fisher and Kinnard were right when they first observed the department store conundrum.
Background
Anchor department stores have taken the prime position in regional and super-regional shopping centers since their advent in the 1950s. The very design of the shopping center was to create a finite shopping environment which brings a mix of national, regional and local businesses together into a central location. These businesses operate independently of one another, but have a defined common goal to advertise and promote their business jointly within that controlled environment. The theory, design and environment were natural for the anchor department store, and as new malls were developed, anchor department stores expanded at multiples of two, three and four, etc.
In recent years, as many of the earlier shopping centers began to age, the industry began to question the economic life of a typical shopping center, and began to acknowledge that its economic life, due to functional and/or architectural obsolescence, may be considerably shorter than its physical life. Concomitantly, the retailing marketplace was going through its own transformation as freestanding discount department stores and big box developments began to provide formidable competition to the malls and anchor department stores. Reacting to the competitive pressure, anchor department stores began to contract or downsize their physical properties, and to consolidate brand names. Then, in the middle of this natural metamorphosis, a recessionary economy took hold. The natural result of this change has been consolidation, downsizing, and repositioning of the retail market. A by-product of this change has been more comparable data including the sales of several anchor department stores.
Currently, due to a variety of market conditions, anchor department stores represent what is commonly referred to as a “limited-market property” or “a property that has relatively few potential buyers at a particular time.” As such, there are a finite number of anchor department store brands in existence today, e.g., Macy’s, JCPenney, Nordstrom, Sears, Dillard’s, etc., compared to a decade ago. Furthermore, in any given operating mall it is highly likely that a particular brand name, or a subsidiary of the remaining brands, already exists. Thus, the supply and demand relationship for anchor department stores is influenced by the disequilibrium between the buyers, sellers and users in the marketplace.
The declivitous direction of the retail market over the last few years has served to call attention to the changing trends in retailing, and exacerbates the identity of inherent obsolescence in larger, multi-story department stores. Most retailers will agree that department stores are not designed or built like other generic or general purpose retail properties. Discount department stores, for example, tend to be built as smaller, single story, consumer accessible structures, which represent what most appraisers refer to as a “general purpose” retail type building. Similarly, office buildings are typically constructed with a multi-tenant objective with flexible and re-usable tenant improvements for maximum efficiency. By contrast, anchor department store layouts, size, construction materials, fixtures, etc., are designed for specific merchandising or product displays with specific areas dedicated to traffic efficiency, customer service, fitting rooms, and to a lesser degree management offices and merchandise stock areas. The lighting, for example, is intended as a combination of normal illumination and special lighting for merchandise display areas. Wall mounted case goods with crown molding and wainscoting have the appearance of being real estate to the observer, but represent trade fixtures to the retailer. In-store boutique displays of named brand vendors, e.g., Polo, Nautica, Ralph Lauren, are custom-made trade fixtures designed to promote the merchandising and brand identification of the vendor. These boutiques are trade fixtures to the vendor and their size, shape and construction are stipulated to between the boutique and the department store in various merchandising agreements between the parties.
Of considerable importance is that each major department store has its own particular “trade dress” or signature identification. Dillard’s stores have a far different appearance from Sears stores, both of which are recognizable to the casual shopper. Nordstrom stores are also easily recognizable. While some stores tend to imitate many of the more successful features of other department stores, this rarely alters their own particular trade dress overall.
There is also a size differential between anchor and discount department stores. While discount department stores represent approximately 70,000 to 100,000 square feet of ground floor space, anchor department stores are mostly two stories and sometimes three stories in height, and contain 100,000 to 300,000 square feet. Therefore, anchor department stores are distinctly different in physical characteristics from those of discount department stores, thus making retail sales figures, rental rates, and economic comparisons between them less than meaningful.
For the average consumer, the physical distinctions between the anchor and discount department store are subtle and non-discernible. They have no relevance to the consumer other than product availability and price points. To the experienced appraiser, however, a department store’s trade dress, the boutiques, the second or third floors, and the size differentials all represent a superadequacy (an excess in the capacity or quality of a structure or structural component; determined by market standards) in terms of resale or alternate use considerations. Therefore, superadequate features, coupled with a limited supply of potential users and/or buyers, sets the stage for obvious market discounts, or as expressed in the valuation lexicon: obsolescence.
A highly important element to be recognized in the valuation of an anchor department store is the knowledge that it is very unlikely one anchor department store will adopt or use the trade dress (tenant improvements) of another anchor department store. This condition alone results in an immediate discount of most, if not all, surviving tenant improvements in a store, regardless of the age or condition of the tenant improvements. For example, when Von Maur purchased the former Lord & Taylor store in the Polaris Fashion Place Mall in Columbus, Ohio, the property was stripped of Lord & Taylor’s three year old tenant improvements and replaced with the Von Maur trade dress. While there are exceptions to this practice, it is generally an axiom of the industry that the trade dress of one anchor will not be re-used by another anchor. This practice supports the hypothesis that the actual construction cost of an anchor department store represents a value-in-use to the retailer rather than a fee simple or generic use to other retailers. Hence, the business enterprise component attributed to Professors William Kinnard and Jeffrey Fisher. The derivative of this argument is that functional and/or external obsolescence are inherent in the department store’s initial construction as well as its actual cost of construction. To the appraiser/assessor, it is a challenge to identify and quantify these components in the appraisal process.
Anchor Department Store Obsolescence – The Theory
When department stores are built they strive to set up their tangible real estate as separately identifiable and distinctive from their competition. From low end stores with vinyl fast tracks and inexpensive ceiling tile to higher quality stores with marble fast tracks and decorative ceiling treatments, the design, materials and quality of the store’s interior finish serves to portray the distinctive image or trade dress of a particular retailer, with the unquestionable objective being to promote the store and set its products apart from its competitors.
Many facets of a department store, that at first appear to be real estate, are actually trade fixtures that have been installed for merchandise or product display purposes. Interior wall treatments are set up for the purpose of displaying goods, clothing, shoes, tools, tires, etc. Spot, track and can lights are placed within a store to focus on certain displays or merchandise. The conjoining of real estate and trade fixtures is part of a store’s merchandising plan, and represents an investment in real and personal property, furniture, fixtures, marketing design, etc. Hence, the concept of a value-in-use to the merchant begins to make sense.
In many areas of a department store there are vendor specific and vendor supplied tenant finishes. Polo’s mahogany wood trim and accent moldings are intended to create an atmosphere for selling the Polo product line. Nautica flooring, wall cases, and crown molding do the same. The initial costs of these specialized trade fixtures are costs to the store, however, and are fully or partially reimbursed by the vendor. When the merchandise agreement ends, the fixtures are not used for other product lines, and removal costs are paid by the store. While these finishes appear as real estate, they are not tenant finishes that are transferable nor suitable for another user of the space, which means that their economic life/useful life is likely to be shorter than that for “standard” building components.
From a fee simple perspective, department store obsolescence can be either external or functional. Department stores generally incur market based functional obsolescence from two sources: from the fact that when a store is originally built, it is designed and built to project the store brand’s particular “trade dress,” and/or the store’s size and multi-story configuration.
A source of market based external obsolescence is that the sales productivity and income being generated by the department store is not sufficient to sustain its level of operations. Most often, a department store’s market based obsolescence is a function of both external and functional obsolescence. For example, a store’s size can contribute to both its functional and external obsolescence. Imagine a store doing $30 million of sales per annum. If the store had 300,000 square feet, the sales per square foot, which is the common denominator of all retail activity, would be $100.00 per square foot. By contrast, if the store had 150,000 square feet, its sales productivity would be $200.00 per square foot. With the average anchor department store having sales of approximately $180.00 per square foot, and a given gross leaseable area of 148,796 square feet, it is obvious that both functional and external obsolescence can be present simultaneously.
Documentation of Functional Obsolescence
The Dictionary of Real Estate Appraisal originally defined functional obsolescence as, “An element of depreciation resulting from deficiencies or superadequacies in the structure.” Currently, the definitions that are in the IVS Glossary is “a loss in value within a structure due to changes in tastes, preferences, technical innovations, or market standards. Functional obsolescence includes excess capital costs and excess operating costs. It may be curable or incurable. Also, called Technical Obsolescence” and in the Dictionary of Real Estate Appraisal as “the impairment of functional capacity of a property according to market tastes and standards.”
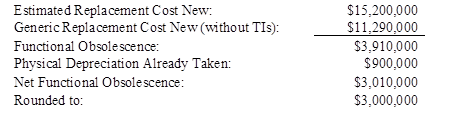
Functional obsolescence can be calculated based on the superadequacy of an actual department store as compared to the replacement cost new of a hypothetical department store without the store’s particular trade dress or tenant improvements. For example, the superadequacy of interior finish has been quantified below by performing a replacement cost new estimate for a generic store of the same size and quality of an actual operating store, but without its interior physical attributes. For analytical purposes, functional obsolescence is considered to be the depreciated difference between the replacement cost new of the existing store costing, say $15,200,000 against the cost of the same generic store without tenant improvements. The calculations are summarized below:
External Obsolescence
The Appraisal Institute originally defined external obsolescence as, “An element of depreciation; a defect, usually incurable, caused by negative influences outside a site and generally incurable on the part of the owner, landlord, or tenant.
Now, The Dictionary of Real Estate Appraisal, 5th ed. defines external obsolescence as “an element of depreciation; a diminution in value caused by negative externalities and generally incurable on the part of the owner, landlord, or tenant.”
Department Store Obsolescence Study
The authors have coordinated a study of 12 anchor department store sales having ages of from 2 years to 48 years. On the following pages, the theory, the methodology, and the trend line by age is graphed and presented. The trend line of total obsolescence serves to demonstrate the relationship between price and obsolescence as properties age.
Documentation of Obsolescence Methodology
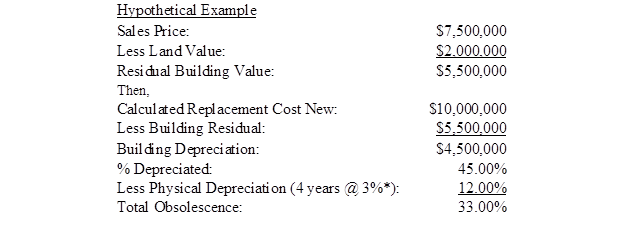
The technique employed to identify obsolescence from all sources is the traditional building abstraction method. This method first removes the land value from a sale price to arrive at the residual building value as shown below for a hypothetical store. Calculations are as follows.

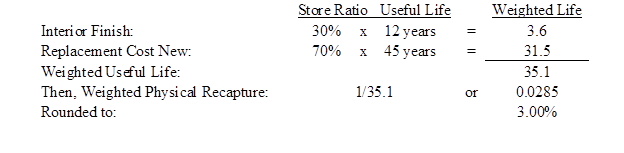
*Physical depreciation is based on the ratio of a store’s interior finish to the total cost. For example, if the interior finish of a store represents approximately 30% of the replacement cost new, and has a useful life of 12 years, the calculation for physical depreciation is as follows:
A Representative Comparable
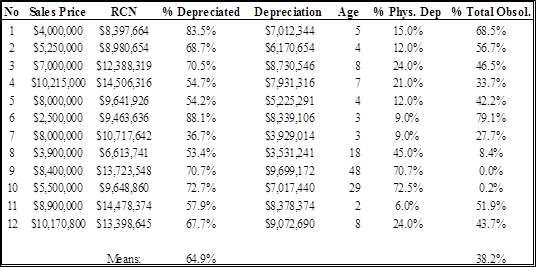
As previously mentioned, the authors have investigated 12 sales of anchor department stores. The stores range in size from approximately 77,500 square feet to 225,000 square feet, and average 156,000 square feet; they range in age from 2 years to 48 years, the average age being 11 years.
The comparable illustrated is a former department store in the Midwest. The sale information and obsolescence calculations are as follows:
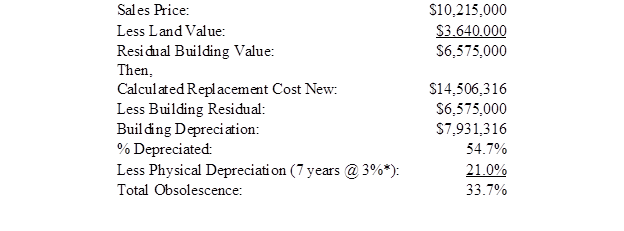
As noted, the seven year old store was depreciated by approximately 55% overall, of which 33.7% represents obsolescence.

*It is noted in an earlier calculation of functional obsolescence that it is then possible to bifurcate obsolescence between external obsolescence and functional obsolescence.
Presented below are the results of the authors’ obsolescence study. The subset of obsolescence comparables are graphed and summarized below. The trend line of obsolescence clearly explains the severe discounting of anchor department store sales that take place in sales less than ten years of age. Naturally, as properties age, the differences between physical depreciation and obsolescence tend to inversely converge as evidenced by the graph below.
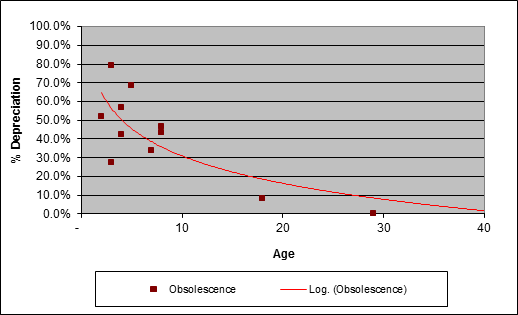
From the market based evidence presented, it appears that Professors William Kinnard and Jeffrey Fisher‘s department store conundrum continues to be confirmed by the presence of new empirical data. The department store sales, which represent a value in use from a cost basis, adjusted for physical depreciation, unamortized tenant finish (trade dress), and other superadequacies tend to result in purchase prices considerably below their replacement cost new. As the obsolescence study strongly suggests, depreciation from all sources averaged approximately 65%, of which total obsolescence represented 38%.
Challenged by the conjecture of Professors William Kinnard and Jeffrey Fisher, the authors contend that the department store conundrum can be confirmed and justified by employing existing market data, and carefully quantifying the various components of functional and external obsolescence.
Special Thanks to Maureen McGoldrick, MDM Appraisals, LLC and James R MacCrate, ASA, MAI, CRE, MacCrate Associates LLC for their contributions


 Regions has shed 46.81% of their Construction loans in the last year and is sitting at a 23.47% NPL rate. They have restructured 18.11% of their C&D loans. The good news is that as they increase their restructured levels it is driving the NPL rates on the restructured loans down from 59.42% to 47.76%.
 For this section I have included banks with less than $2 Billion in assets and who had Construction loans in both 2010 Q3 and 2011 Q3. While not a perfect indicator, it should be a reasonable approximation of Community Bank Construction lending activity over the last year.
 Surprisingly, 31.38% of institutions actually increased their lending year over year. This is not to say they grew their portfolios 31.38%, but rather they did increase the dollar amount at least $1 year over year. Finally, note the relationship with asset size.


You must be logged in to post a comment.